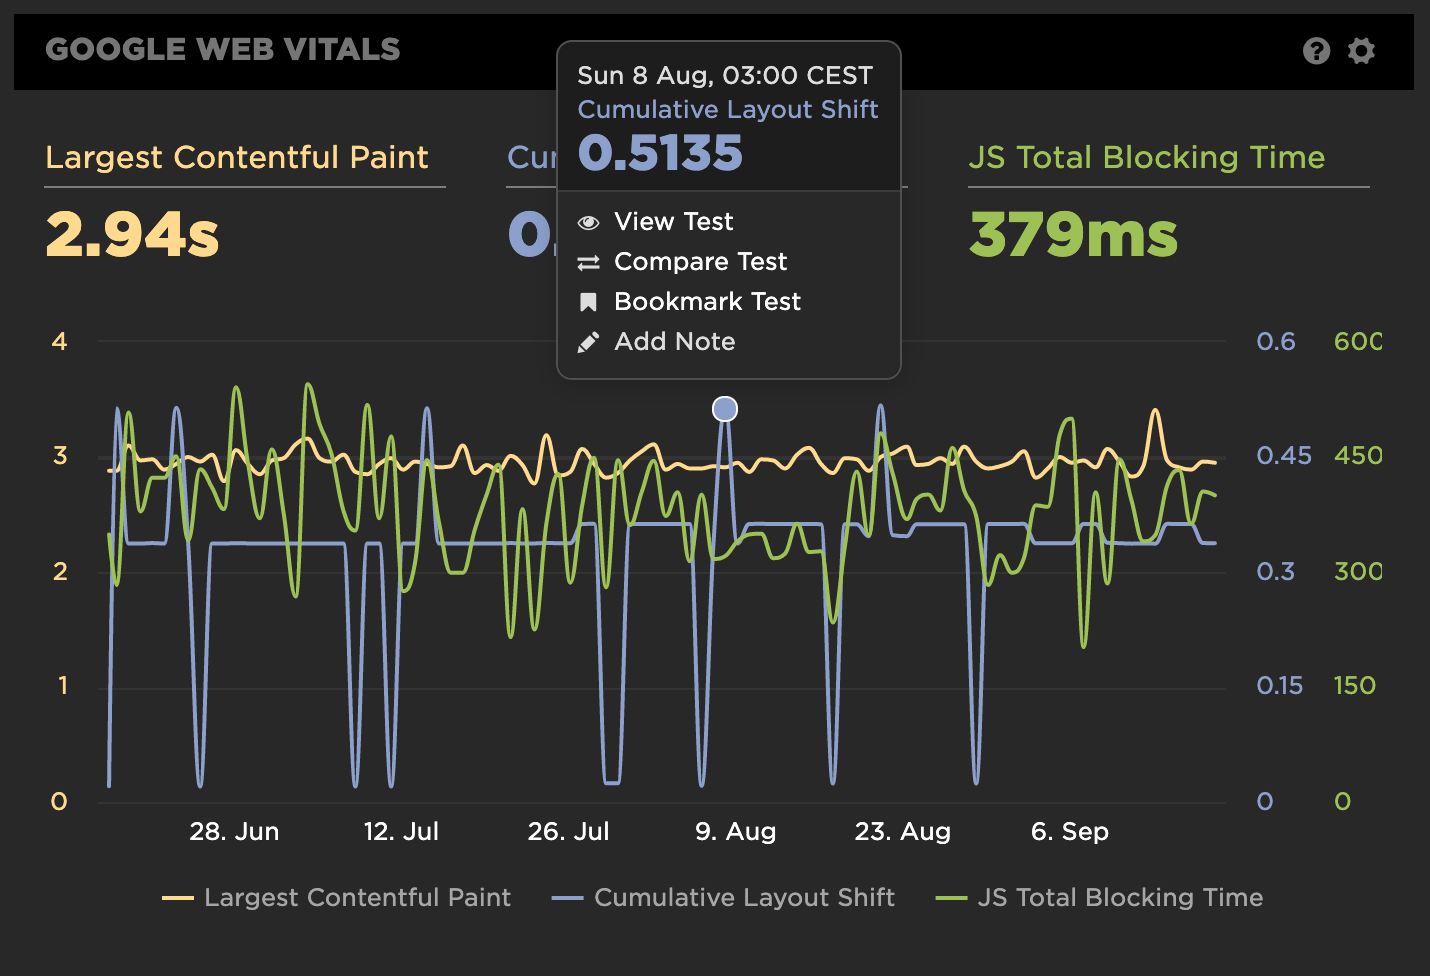
Introduction to CLS - Cumulative Layout Shift
If you’ve ever played around with SpeedCurve and its charts you probably know you have the option to go further into each test that makes up a chart by clicking on a chart sample and selecting view test.
In this post we'll quickly look at what CLS is, how it's measured within Speedcurve and tips on how to mitigate layout shifts.
Clicking on a chart sample takes you to a detailed view, giving you the opportunity to really focus on the output of a certain metric, and in this particular example, we’re going to look at one of the Web Vital metrics:
CLS - Cumulative Layout Shift.
CLS occurs when something forces a recalculation of the page layout (a shift). The score is derived from how much elements shift before stabilizing and a CLS score greater than 0.1 means you have things to improve.
- Good – CLS below 0.1,
- Needs improvement – CLS between 0.1 and 0.25,
- Poor – CLS above 0.25.
Big shifting fruit
The word cumulative means the sum of or the collections of (in our case shifts), and it is important we look at all shifts that collectively result in our CLS score. But in reality, when working to improve your CLS score, your efforts will obviously pay off more if you deal with the bigger shifts first.
To identify these, just know that greater shifts result in larger blocks of red coloration on the screenshot sample and that you can look at the Cumulative Score for each screenshot to compare them against each other.

Parting thoughts
Although it’s sometimes tricky to mitigate shifts, remember they’re often caused by either web fonts without fallbacks (or fallback that doesn’t resemble the web font), late CSS imports hidden from the preload scanner (avoid @import at any cost!), ads, images without set dimensions and by third parties manipulating the DOM.
/ ND